Observability Agent
This example creates an agent from a recipe that answers questions about production and investigates incidents with your metrics, logs, traces and profiles.
What you'll learn
- How to create an agent from a recipe, and leave out the connectors you don't have
- How to give the agent read-only identities
- How to describe your environment to the agent
- How to share the agent with your team, and update it to a newer version of its recipe
The recipe is in recipe/. It uses Grafana for every signal, and optionally your Kubernetes cluster and GitHub repositories.
Prerequisites
- The
a2aCLI anda2a-serveinstalled (see Getting Started), with Docker. - An API key for the model, such as
OPENROUTER_API_KEY, exported in your shell. - Grafana 9 or later with datasources for your metrics, logs, traces or profiles. Without one, see Try it on your machine.
- Optional:
kubectlaccess to your cluster, and a GitHub account with access to your service repositories.
1. Create read-only identities
Anyone who can call the agent can make it read what its identities can read. Give it the access you would give its callers.
Grafana. In Grafana, open Administration, Users and access, Service accounts. Add a service account with the Viewer role, add a token to it, and export it with the URL of your Grafana:
export GRAFANA_URL=https://grafana.example.com
export GRAFANA_SERVICE_ACCOUNT_TOKEN=glsa_...
Kubernetes (optional). Create a ServiceAccount bound to the built-in view ClusterRole, which can't read Secrets, and write a kubeconfig for it to ~/.kube/a2a-o11y:
kubectl create serviceaccount a2a-o11y -n default
kubectl create clusterrolebinding a2a-o11y-view --clusterrole=view --serviceaccount=default:a2a-o11y
TOKEN=$(kubectl create token a2a-o11y -n default --duration=720h)

mkdir -p ~/.kube/a2a-o11y
K="--kubeconfig $HOME/.kube/a2a-o11y/config"
kubectl config view --minify --raw -o jsonpath='{.clusters[0].cluster.certificate-authority-data}' | base64 -d > ~/.kube/a2a-o11y/ca.crt
kubectl config set-cluster o11y --server="$(kubectl config view --minify -o jsonpath='{.clusters[0].cluster.server}')" \
  --certificate-authority="$HOME/.kube/a2a-o11y/ca.crt" --embed-certs $K
kubectl config set-credentials a2a-o11y --token="$TOKEN" $K
kubectl config set-context o11y --cluster=o11y --user=a2a-o11y $K
kubectl config use-context o11y $K
rm ~/.kube/a2a-o11y/ca.crt

cat > ~/.kube/a2a-o11y/config.toml <<'EOF'
read_only = true
kubeconfig = "/kube/config"
EOF
The agent sees this directory at /kube, read-only. The cluster's API server must be reachable from the agent's container. The token expires after 30 days; create a new one and run set-credentials again before then.
GitHub (optional). Create a fine-grained personal access token with read-only access to Contents, Pull requests and Actions of your service repositories, and export it:
export GITHUB_TOKEN=github_pat_...
2. Create the agent
cd ~
a2a-serve recipe https://github.com/a2aproject/a2a-serve/tree/main/examples/04-observability-agent/recipe \
  --name o11y --model openrouter/~google/gemini-flash-latest
The command shows what the agent will run and asks before it creates it in ~/o11y. It then offers the variables you exported, and asks whether to use github and kubernetes. Answer n for a connector you don't have. Kubernetes stays off without ~/.kube/a2a-o11y.
To create the agent without questions, such as in a script, export the variables and add --yes. Optional connectors without their variables stay off:
a2a-serve recipe https://github.com/a2aproject/a2a-serve/tree/main/examples/04-observability-agent/recipe \
  --name o11y --yes --secret OPENROUTER_API_KEY --model openrouter/~google/gemini-flash-latest
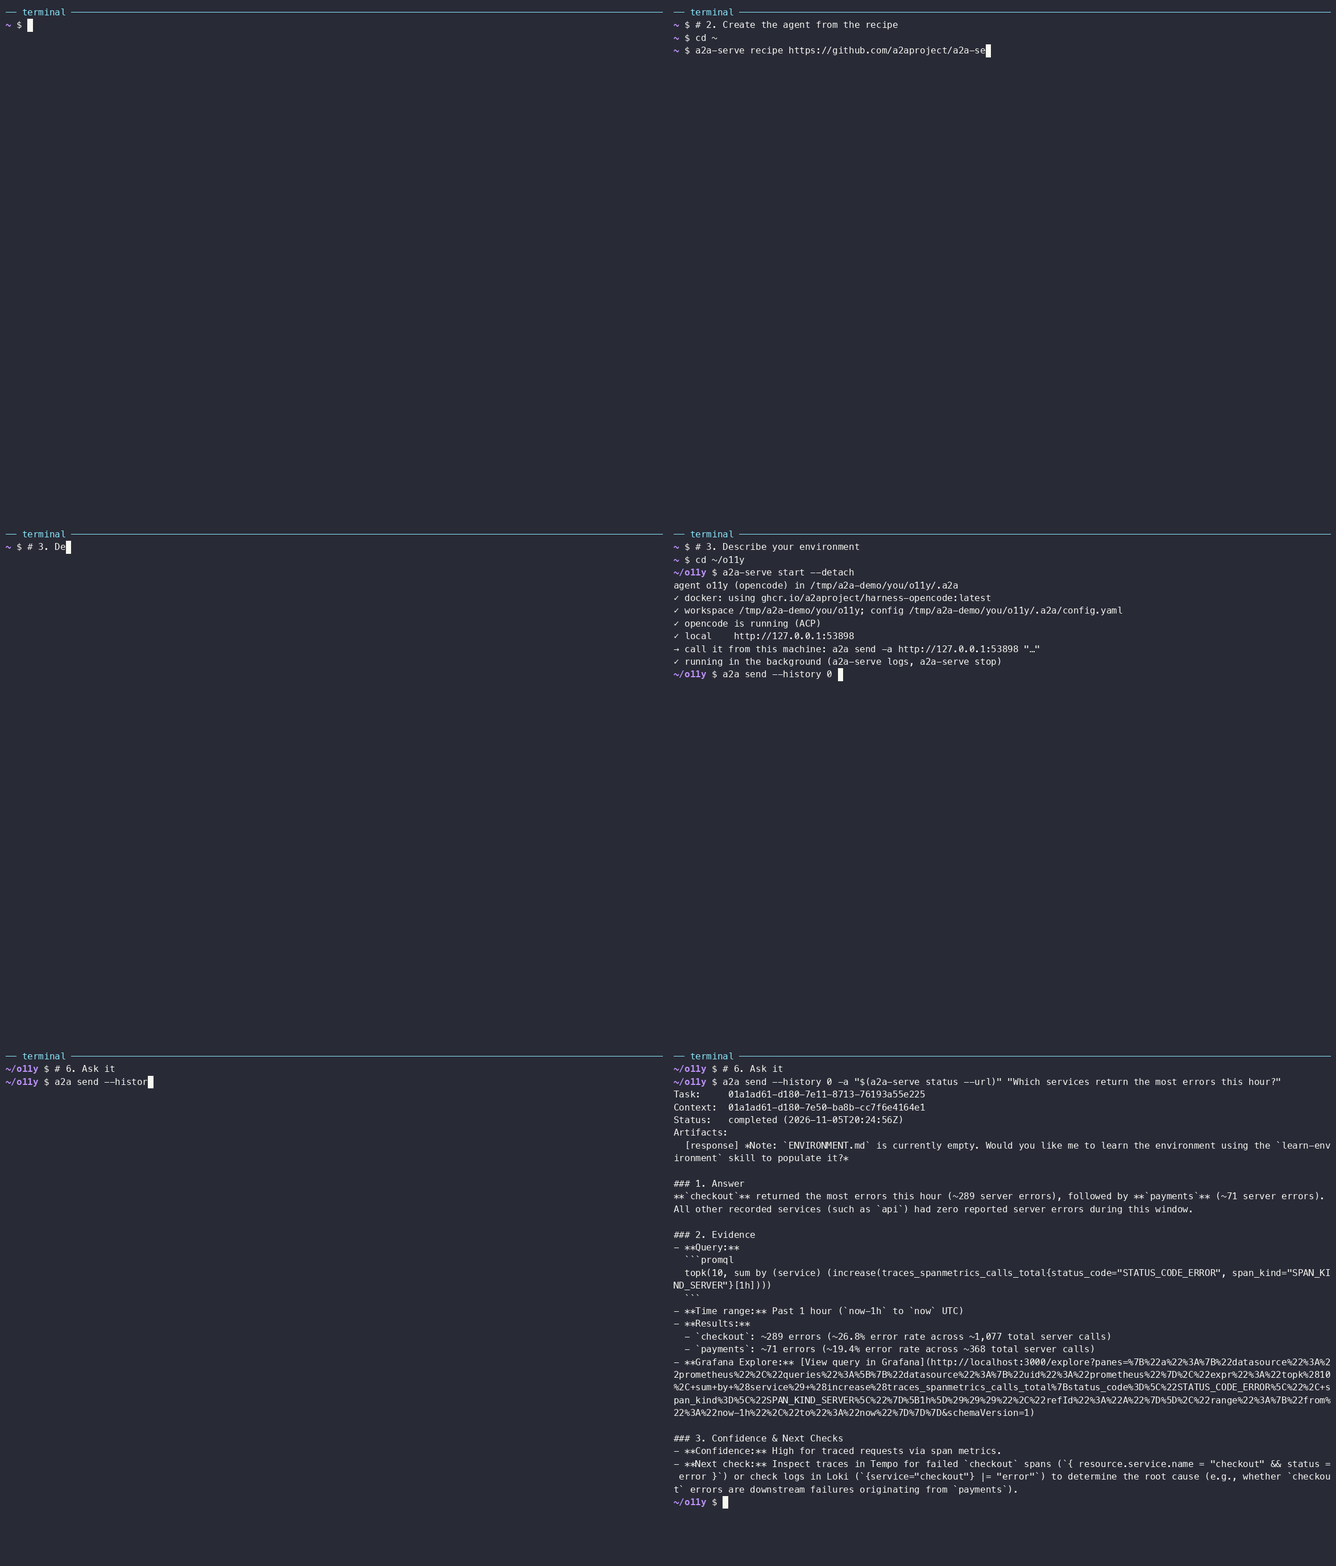
3. Describe your environment
The agent reads ENVIRONMENT.md before every investigation. Fill in ~/o11y/ENVIRONMENT.md with your services, datasources, label conventions, dashboards and SLOs. Or start the agent and ask it to learn the environment:
cd ~/o11y
a2a-serve start --detach
a2a send --history 0 -a "$(a2a-serve status --url)" "Learn the environment."
It answers with a proposed ENVIRONMENT.md. Review it, then save it to the file. The agent can't edit its workspace.
4. Approvals
The agent runs its MCP tools, such as a Prometheus query, without asking. Each MCP server here is read-only on its own side: mcp-grafana runs with --disable-write, GitHub's endpoint is read-only, and the Kubernetes identity has the view role.
The recipe's approval rules cover the agent's own tools. It reads and searches its workspace without asking. It can't edit files, run commands or fetch URLs: such a call is denied, and the agent answers another way. Approving single MCP tools is planned.
5. Share it with your team
Make the agent reachable on your tailnet and from Telegram:
a2a-serve config set --private tailscale --restart
a2a-serve channel add telegram --token env:TELEGRAM_BOT_TOKEN
Optionally, send a digest every weekday morning:
a2a-serve schedule add morning-digest --cron "0 9 * * 1-5" \
  --prompt "Summarize the alerts and anomalies since 18:00 yesterday." --chat telegram:owner
6. Ask it
a2a send --history 0 -a "$(a2a-serve status --url)" "Why is checkout slow since 14:00?"
a2a send --history 0 -a "$(a2a-serve status --url)" "Which services return the most errors this hour?"
a2a send --history 0 -a "$(a2a-serve status --url)" "Did yesterday's deploy change the memory use of api?"
Each answer starts with the conclusion, followed by the queries, time ranges and Grafana links behind it.
7. Update it
When the recipe changes, update the agent from its directory:
cd ~/o11y
a2a-serve recipe
The update keeps your changes. Your ENVIRONMENT.md stays, and a changed template arrives next to it as ENVIRONMENT.md.recipe. See Recipes.
Try it on your machine
Without a Grafana of your own, run grafana/otel-lgtm, which bundles Grafana with Prometheus, Loki, Tempo and Pyroscope:
docker run -d --name lgtm -p 3000:3000 -p 4317:4317 -p 4318:4318 grafana/otel-lgtm
Create a Viewer service account and a token with Grafana's API. The image's admin login is admin, password admin:
SA=$(curl -s -u admin:admin -H 'Content-Type: application/json' \
  -d '{"name":"a2a-o11y","role":"Viewer"}' http://localhost:3000/api/serviceaccounts | jq .id)
export GRAFANA_SERVICE_ACCOUNT_TOKEN=$(curl -s -u admin:admin -H 'Content-Type: application/json' \
  -d '{"name":"a2a-o11y"}' "http://localhost:3000/api/serviceaccounts/$SA/tokens" | jq -r .key)
export GRAFANA_URL=http://host.docker.internal:3000
The agent's container reaches your machine at host.docker.internal. Create the agent as in step 2, and answer n for github and kubernetes. The stack has data once an app sends it OpenTelemetry on port 4317 or 4318.
Clean up with a2a-serve stop in ~/o11y and docker rm -f lgtm.